This post is on 2 pages. Please click on the appropriate page number at bottom of text to navigate.
There’s a very interesting take on UK unemployment trends in the July NIESR Review, written by the NIESR director Jonathan Portes. One should perhaps bear in mind that he has previously worked to formulate employment policy for the Blair and Brown governments.
His essential point is that while the overall UK 16-64 employment rate has remained steady for over 30 years, this has been combined with some major changes in the patterns of that employment. This has major implications for the likely outcome of current government policy towards those out of work and their benefits.
In this post I summarise Portes’s findings and analyse more closely two points his paper overlooked: the impact of increased part-time working and the discrepancy between a rising population, a steady employment rate and falling numbers of benefit recipients. The findings suggest that the situation may be rather more serious than Portes fears, with significant implications for social welfare and cohesion.
Rising Employment, Variable Benefits
Portes shows that UK employment as a proportion of those of working age has remained at over 72% for a decade, yet the number of people of benefits received because of a lack of work or inability to work peaked at 6 million in 1994, triple what it was in 1979, only falling back to somewhere above 4 million in 2008. He identifies the problem as primarily being one of large numbers of men being separated from the labour force through the 1980s and early 1990s. This was probably as the result of a loss of low-skilled jobs and a lack of any existing policy to find them replacement work. At the same time there was a large increase in the number of women in the workforce, despite an increase in lone parents on Income Support.
There is no easy answer to what the social and economic drivers were that caused all this, although Portes credits ‘active labour market policy’ for helping to reduce the numbers of those on benefits long-term from their 1994 peak. This policy started in the mid to late 1990s and consisted of an underlying assumption that ‘if individuals looked for work, they were likely to find it’, with help, support and training to those out of work for whatever reason. There were sanctions for those not complying, but also incentives in terms of tax credits to boost working incomes.
More Sticks, Fewer Carrots
Portes notes the coalition’s shift of emphasis from incentives to sanctions, but is sceptical about the general thrust of policy to make a significant impact on the numbers in work. In particular he questions whether lone parents and those who might previously have claimed benefit on the basis of incapacity are likely to find work. Economic conditions and support reductions, combined with the barriers faced by these particular individuals, will make it difficult to place them. At the same time he notes the erosion of eligibility for benefits and their value. He raises the possibility of
‘more people on JSA [the basic unemployment benefit, currently worth £71/week for over 25s], or worse still out of work and outside the benefit system with little or no income…’.
It’s All Part-Time
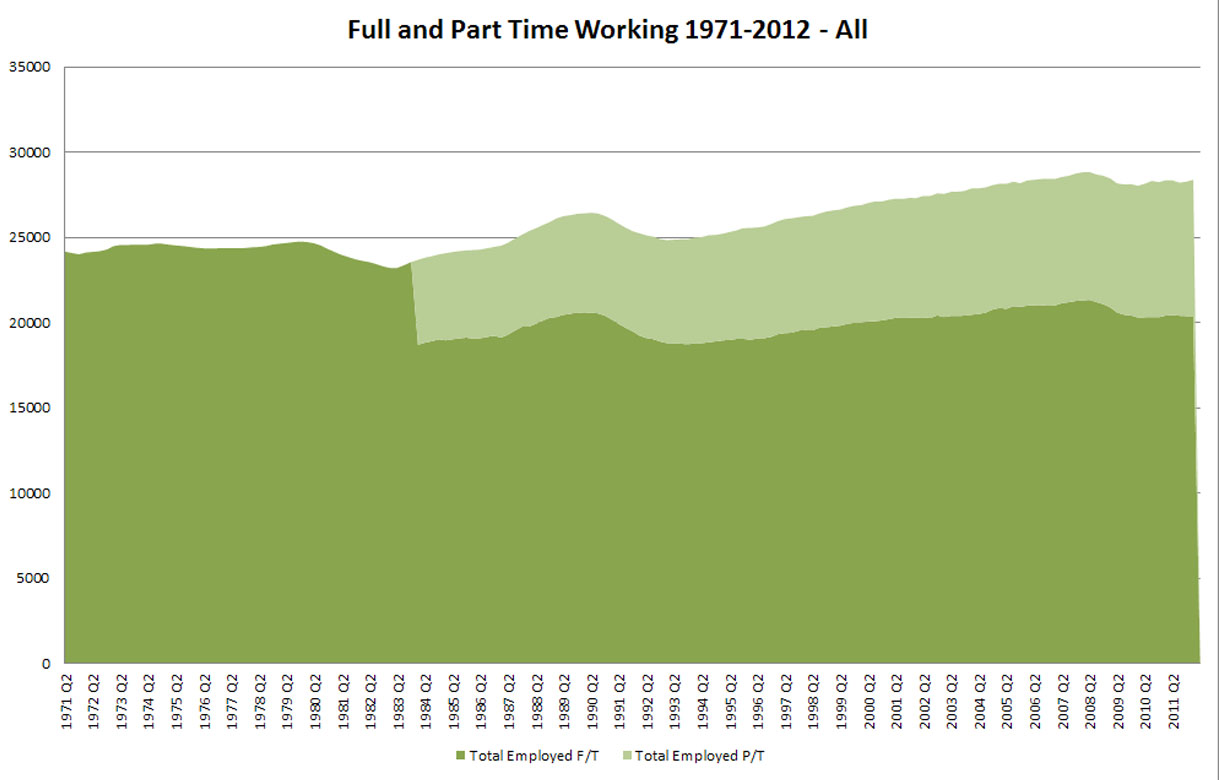
It is important to note what Portes leaves out of his analysis here. The rise in employment required to match the population rise (and so keep the employment rate stable) is very largely an increase in part-time employment, as indicated by Figure 1 below. The number of those in full-time employment peaked at 21.3 million in 2008 and has now fallen below the previous peak of 20.6 million in 1990. Yet at the same time the total number employed is currently only around 0.4 million below its historic peak of 28.8 million in 2008.
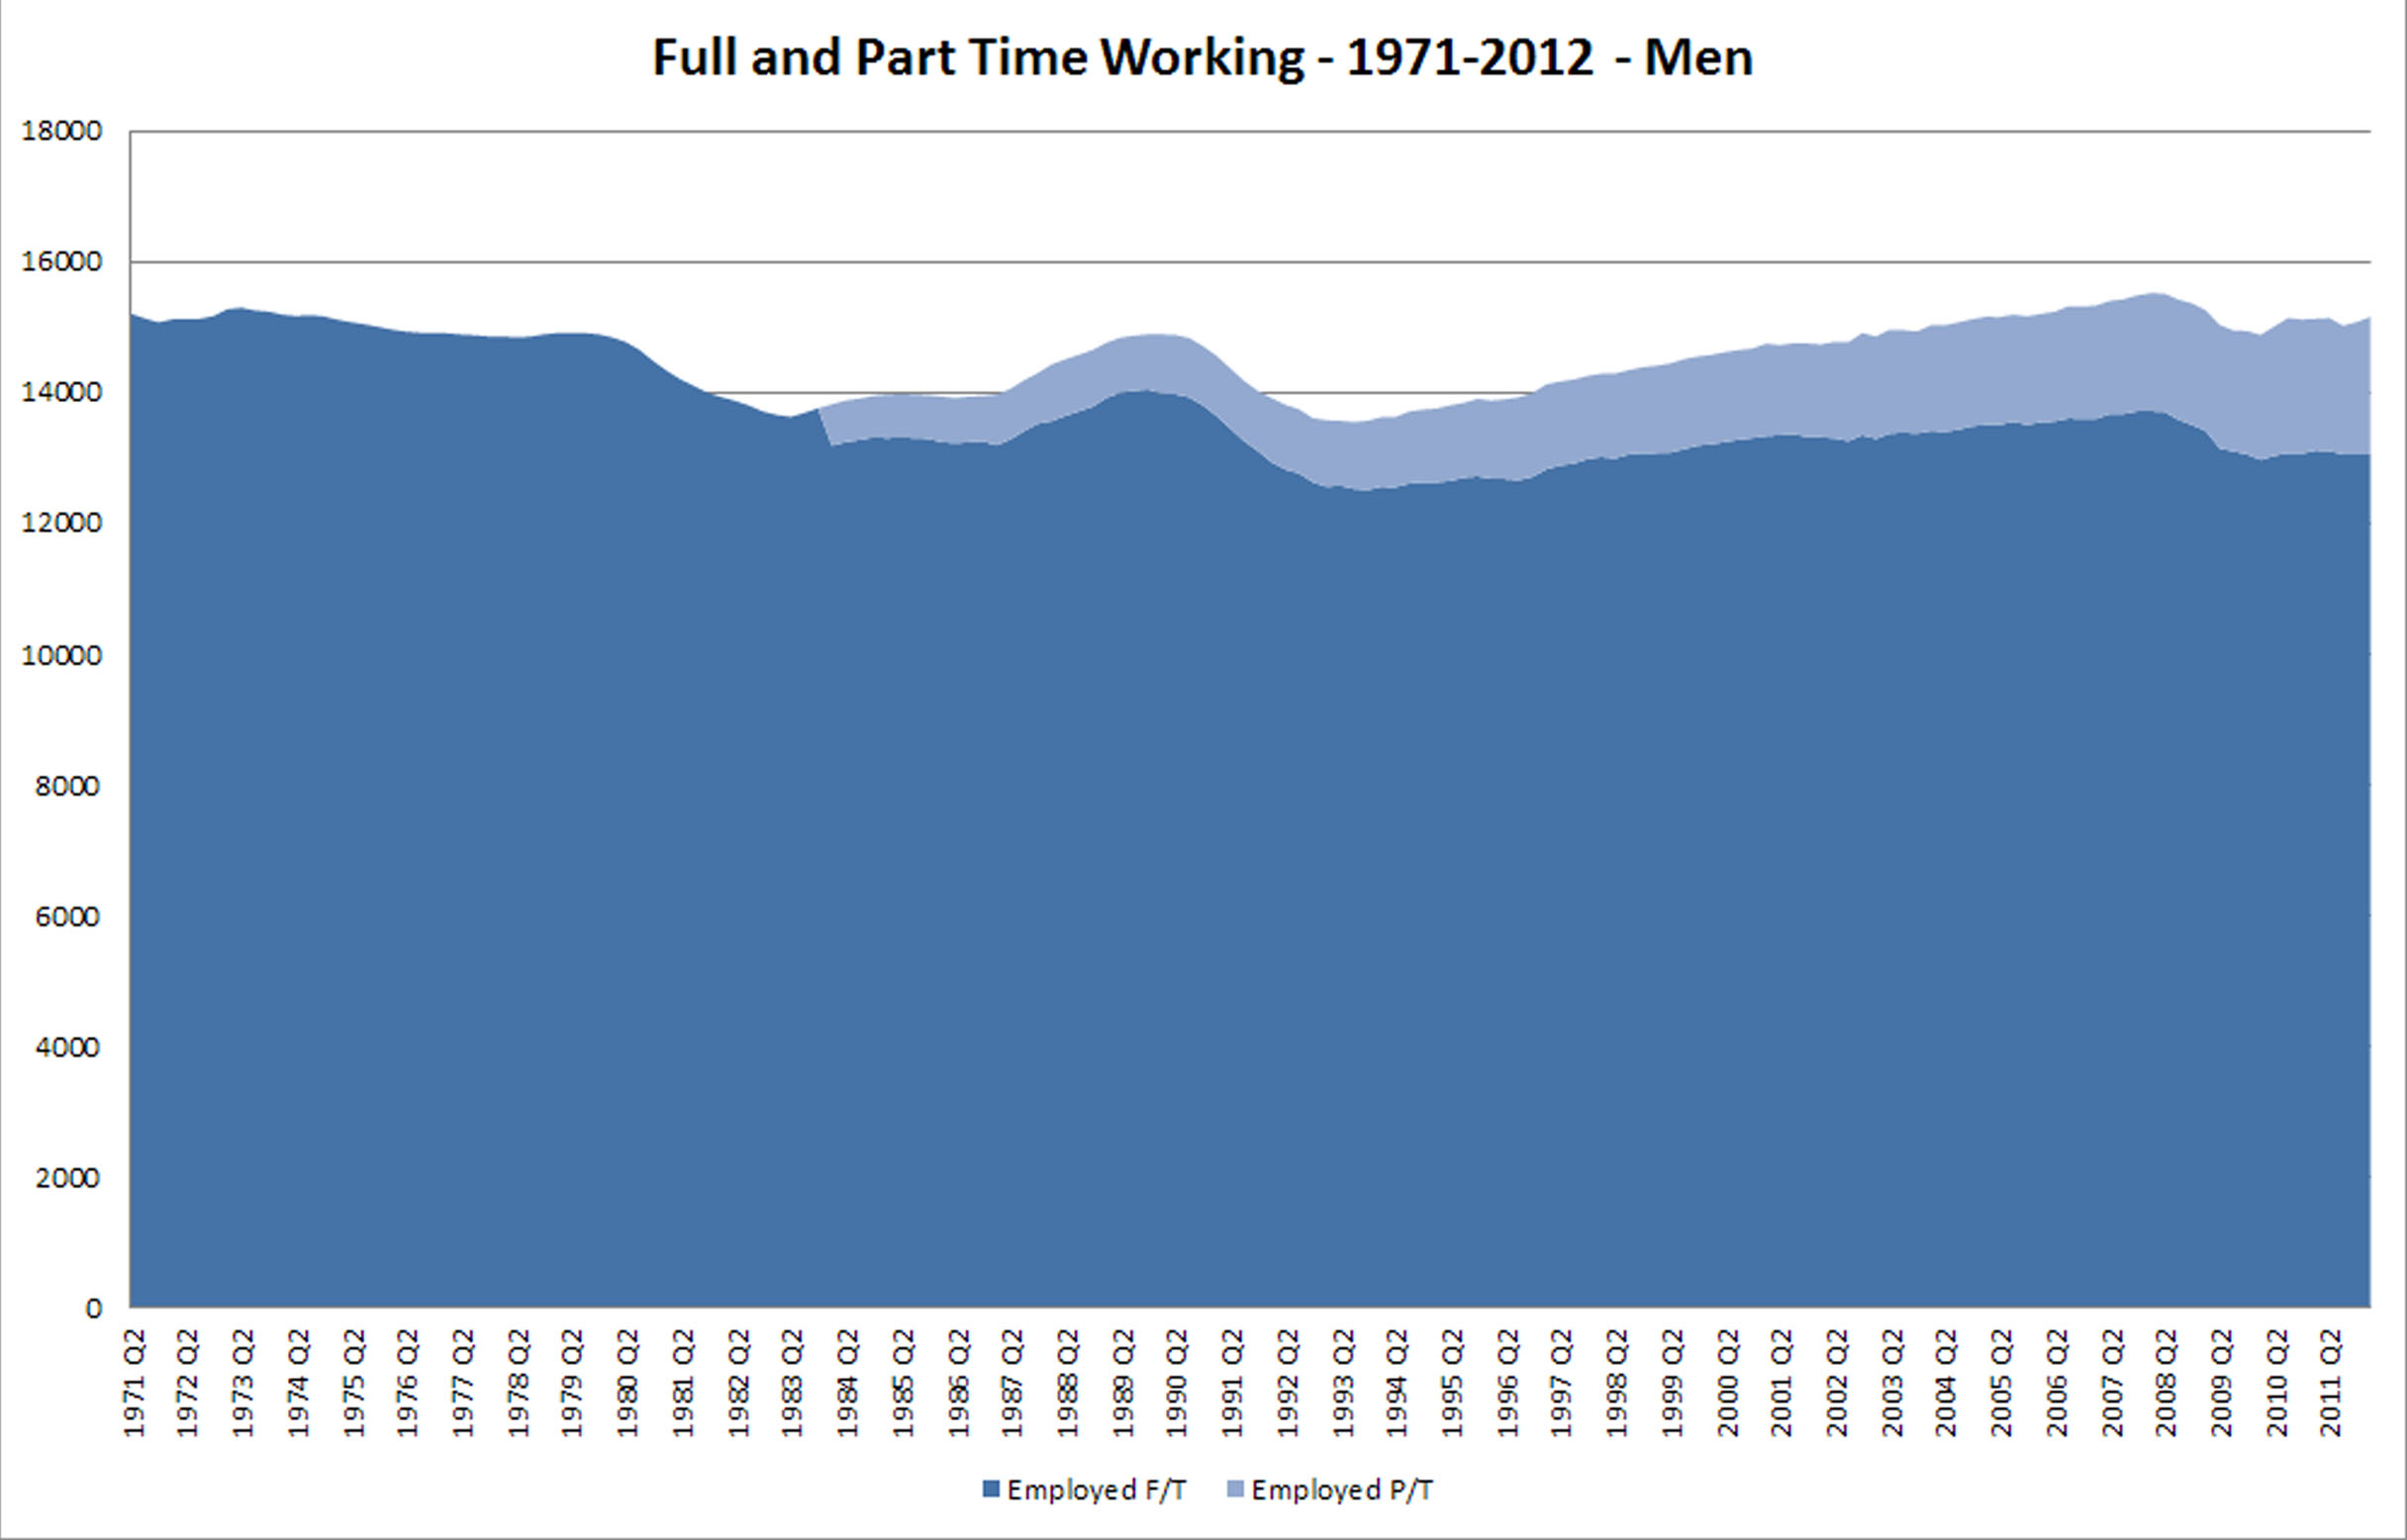
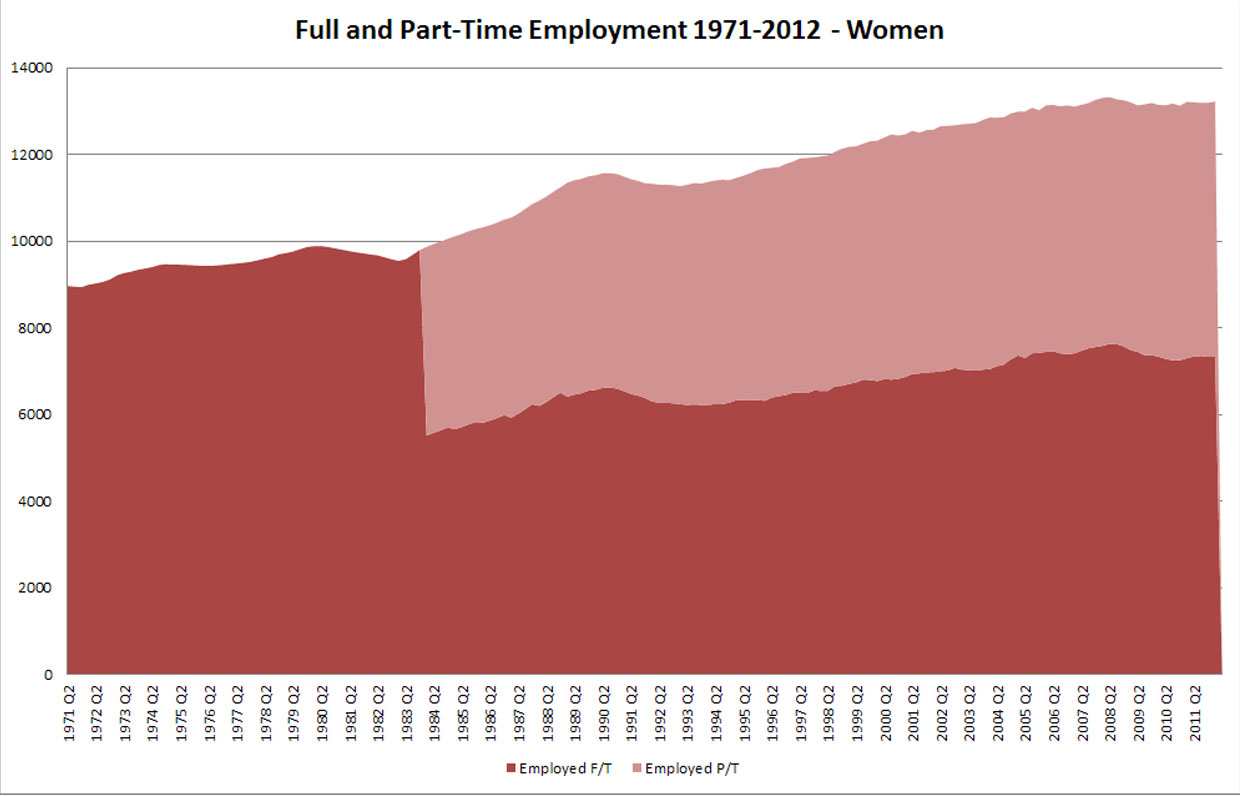
The increase in part-time employment has been roughly shared between men and women. Yet while women have also experienced a steady increase in full-time employment which is now 0.7 million above its 1990 level, full-time employment for men has fallen by 1 million over the same period. This is shown in Figures 2 and 3 below. Portes notes the fall in relative wages for the low-skilled still in work, but doesn’t say anything about how this might itself have helped to push more women into the workforce, often at the expense of lower-skilled men, simply to maintain adequate family incomes.
Source: ONS Labour Market Statistics
One reply on “Unemployment and Policy”
[…] up, employment, from Dr.D. I’ll have to re-read this more […]