The UK’s Public Service Crisis
There is a crisis in public services in the UK. This is longstanding but has been cruelly exacerbated by the COVID-19 pandemic. This crisis is affecting education, legal services, social support and social care, but it is most obvious and most disturbing in the provision of healthcare. Emergency services are overwhelmed, with ambulances queuing up outside hospitals to hand over patients and long waits in A&E departments. Waiting lists for ‘elective’ care (which includes life-saving treatments for heart disease and cancer) are astronomical, reaching a highest ever number of 6.1 million in January 2022. Perhaps most shocking of all – in this same month, of patients who were having their first treatment for cancer following an urgent GP referral, 38% waited longer than two months. The official target for this measure is 15% – a target that has been met in only 1 month in over 7 years.
Various diagnoses are put forward as the cause of these problems: an outdated funding model which leads to ‘bottomless’ demand; an aging population; ever-more advanced (and therefore expensive) medical technology, particularly when applied to that aging population. Whilst there may be some truth in all of these, the fundamental issue may lie much deeper – in the ‘Baumol Effect’. In this piece I will explain this and its impact on our perceptions of the affordability of adequate public services.
Economic Growth and Labour Productivity
‘Economic growth’, as represented by a rising GDP measure (essentially an aggregate of incomes and profits across the domestic economy), has been the most important target of democratic governments since the Second World War. For the UK – once inflation is stripped out – this growth has averaged a ‘real’ 2.3% per annum between 1956 and 2021. This rate of increase means that the basket of goods and services we in the UK can collectively afford has expanded nearly four and a half times over the last 65 years. This aggregate national economic growth has two main drivers: the number of workers and the value of goods and services produced per worker (labour productivity). Labour productivity, being the real monetary value of each worker’s output, is the more important since this largely determines the average income per UK inhabitant, and therefore of our standard of living.
‘Standardisable’ Production
How is labour made more productive? There are three main routes. Firstly workers can be organised in more efficient ways – using ‘the division of labour’ Adam Smith exemplified in his description of a pin factory where the individual stages of the process are distributed to different workers. Secondly, workers can be given access to more efficient machinery: from muscle-power, to horse-power, to the steam engine and eventually to robots where a small team of operators and technicians can manage the output of a huge plant. Thirdly, workers can be educated and trained to a higher level, with skills that produce higher-quality and higher-value output.
With the exception of the last of these three forms of labour ‘enhancement’, a large degree of standardisation is clearly essential for them to be effective. All ‘pins’ made must be capable of manufacture using a similar set and sequence of processes; modern robots may be programmable, but any one robot will have a limited set of tasks it can carry out and cannot easily adapt to unforeseen problems. The outputs of such processes must be capable of working equally well for different people in different circumstances. It is in the nature of many services, and a few goods, that they are not standardisable in this way and require a human being to interact directly with the consumer of the output. Division of labour means lack of ‘continuity of care’ and may in fact be inefficient.
‘Non-standardisable’ Production
Non-standardisability of the production process has two major consequences. Firstly, it is difficult to provide these such services (or goods) using ordinary market mechanisms. A market works well when the good being transferred is easily recognisable and its quality easy to identify before any transaction takes place. For medical services, for teaching, for care services and for several others, this is usually not possible. A degree of trust needs to exist prior to the transaction – lack of it leads to underpricing and thus underprovision. If the service is an essential one and required unexpectedly and urgently, unscrupulous operators have the opportunity to overcharge and defraud their clients.
A common solution to the problem of providing non-standardisable services is for them to be provided through insurance-type mechanisms. This allows a fixed cost (often in the form of a periodic premium) to be paid for the guarantee of service to an adequate standard and when needed. Even this often works poorly because of the financial, personal and social overheads involved in determining costs, service needs and the distribution of contributions. In such cases, the state has frequently taken on the role of insurer with tax contributions as the premiums. This has particularly been the case with medicine, education and social care and support.
The other issue with non-standardisable outputs and their need for person-to-person interactions is that they are limited by the available supply of human-hours. These cannot be replaced by machines or easily made more efficient by technology without dilution of the nature of the service. Skill enhancement may even make the problem worse – the individual provider has a larger set of possible interventions (treatments) to call on in each interaction!
The presence of these two very different types of output, standardisable and non-standardisable, means that an aggregate figure for economic growth tends to be misleading. The vital element of productivity, vital because it determines how much we become individually better off, is not likely to be evenly distributed across all sectors of the economy. It is likely that over time standardisable goods can be made increasingly more efficiently and more cheaply by the use of additional and more advanced capital goods and by technological innovation. On the other hand, those goods and services that are non-standardisable and so rely on intensive human input, if they can be provided more efficiently at all with the same quality, will be so much more slowly.[1]
The ‘Baumol Effect’ of Differential Productivity
The upshot of the discrepancy between labour productivity trends in the two sectors is that over time increasingly more standardised goods can be provided for the same level of human input relative to the quantity of non-standardised labour-intensive goods. The potential impact of this differential productivity effect on public service expenditure was initially recognised by US economist William Baumol. He pointed out that in a competitive labour market where workers have a choice over which sector they work in, the going hourly wage will be driven by their potential output in the most productive sector. This means that as labour productivity in the private goods sector increases, wages will also rise in the less productive public service sector, raising its costs relative to output.
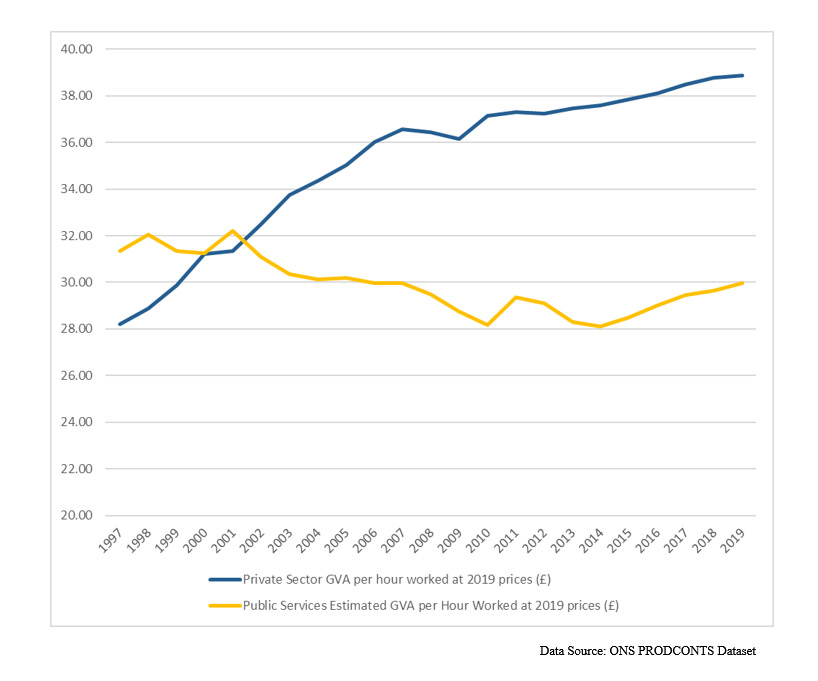
The differential productivity growth between the UK private sector and our public services is clearly illustrated in Figure 1 above. The actual values for productivity are not particularly significant here. Since most public services are not provided on a market basis their value has to be estimated, and this is clearly a fairly subjective process. What we are interested in here is the trends and it is clear that labour productivity has continually increased in the private sector, although less so after the 2008 financial crash than before. Productivity in public services, however, has apparently decreased overall over the past two decades! It also appears to have behaved perversely in the sense that during the relatively generous funding of the Labour governments of 1997-2010, productivity decreased, but then with the ‘austerity’ of the subsequent Coalition and Conservative governments it slightly increased again. This is also consistent with the ‘Baumol Effect’ – more personal attention in the provision of services may be desired, but given the limitations on the ‘efficiency’ of an individual service worker, it may well reduce calculated productivity. Take some of those workers away, and although the service is reduced in quantity and quality, its apparent labour productivity may well increase!
The critical impact of the Baumol Effect is that most goods become cheaper relative to public services, so that any given amount of monetary expenditure can purchase increasingly more goods than public services. If the value of money is measured in standardised goods, then to achieve a constant level of public services requires they receive an increasing share of total monetary expenditure. If the government has become responsible for providing a significant share of such services, then we require government expenditure as a proportion of output as measured by GDP to be increasing to maintain a constant level of provision. This is all without considering whether an aging population or additional effective medical interventions or the desirability of a bigger role for advanced education mean that we should be actually increasing the level of such provision in any case. Moreover, it should be noted that in the presence of overall increasing productivity, no standardised goods need be ‘given up’ to increase the proportion of spend on public services. We simply make a choice to increase the rate at which we transfer to our public services additional resources relative to the rate at which we acquire yet more standardisable goods. We can do this without sacrifice because of the increased efficiency in the production of these latter goods.
The Baumol Effect in the Economics Literature
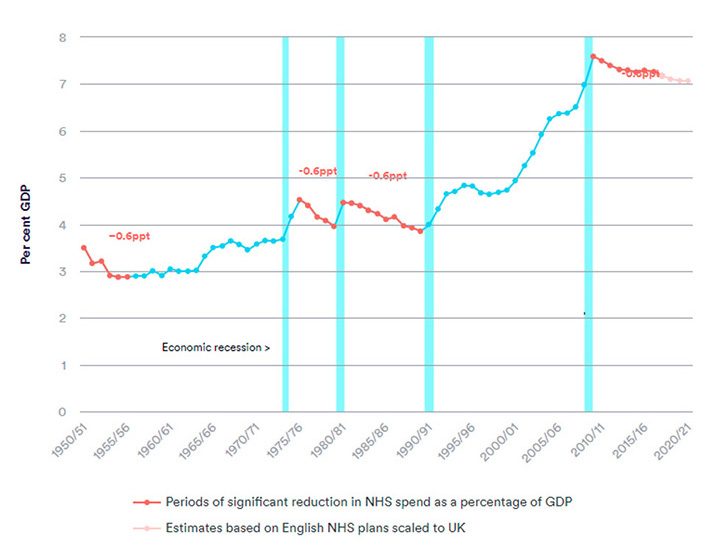
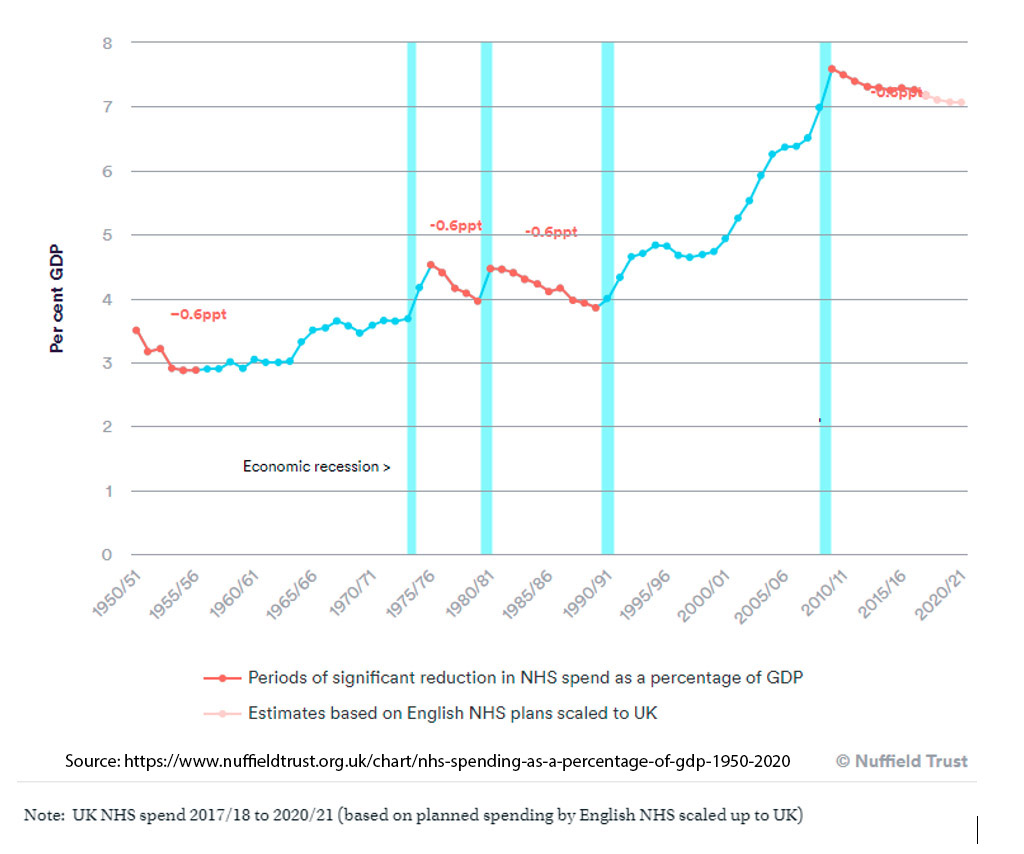
The academic literature on the Baumol Effect and its consequent ‘unbalanced growth’ focuses primarily on the impact on economy-wide health expenditure. Most empirical studies conducted strongly suggest that the gap between average wages and overall productivity as measured by real GDP – has a significant positive effect on national healthcare expenditure.[2] The difficulty involved in distinguishing other probable relationships involved, such as that with rising affluence generally – since we tend to demand more healthcare as we get richer, aging and technology, or rising administration costs, makes this finding challengeable however. Moreover, it is difficult to see this question as other than of academic interest, particularly in the UK where health spending is not generally an outcome of economic demand drivers but of political and political economy effects. The non-proportional UK electoral system tends to produce alternating one-party rule supported by a minority of the electorate. The responsiveness of each regime to ongoing public opinion pressure between elections may be quite limited, leading to persistence with individual policies that lack public support. On this basis it may be that UK governments are able to resist pressure to adequately resource health and social care services more than most, particularly when the UK’s NHS is almost wholly funded from general taxation without even the market veneer of state-subsidised health insurance schemes. (See Figure 2 below for the effect this creates.)
What Does the Baumol Effect Mean for the ‘Affordability’ of Public Services?
Given the nature of NHS and other public service funding in the UK, it seems more useful to consider how the Baumol Effect impacts on the difference between the apparent and actual affordability of health, social care and other public services. Much is made of the fact that the current Conservative government are spending ‘record amounts in real terms’ on the NHS. In the face of a rising population and ongoing economic growth, this tells us nothing about the whether the allocation of resources to healthcare is the correct one – that which would command majority informed support. Somewhat more meaningful is health expenditure in relation to GDP. A constant proportion tells us that monetary resource provision at least is rising in line with population and with national economic output. The Baumol Effect, however, tells us that we cannot put too much reliance on this relationship with overall growth. In the face of a national labour market the gap between labour productivity growth in the private, goods generating, sectors of the economy and that in the public service sector, tells us that their comparative costs will change over time. To maintain real healthcare ‘output’ as a proportion of total national output will in fact require an increasing rather than a static share of monetary inputs.
That this is true is not in itself an argument for making that shift. Firstly, there may be a ceiling on the quantity of public services that we need or desire. Perhaps more public services above a certain point would not make us any healthier or happier. Secondly, even although we would like more healthcare and other public resources, perhaps we would even more like many more goods. In this case we may not be willing to transfer resources from their production and acquisition to the provision of more services. In the UK, this is not a decision that can, for the most part, be taken in the market (whether we would be better off if we could is a different debate) but is a political one to be taken at the ballot box.[3]
The Choice Between Better Public Services and More Consumer Goods
What we can do, however, is clarify for ourselves the choices we have between additional private goods consumption and public service provision. Apart from identifying the true affordability of such public provision, we should also be clear that when we settle for lower levels of such provision there should be a bonus in terms of additional private goods and services that we all have a potential share in.
To try and understand how this differential productivity between private goods provision and public services affects us I have calculated the cumulative annual real (adjusted for inflation) increases of private goods output and of the current expenditure of central and local government from 1999 until 2019. I have stopped at 2019 because it is clear that the Covid pandemic both impacted output and productivity and led to more or less involuntary additional spending on public services. This additional spending occurred directly through additional healthcare expenditure and indirectly through employment and business subsidies. The rhetoric of the current Conservative government suggests that they intend to claw back much of this impact on the public finances – which suggests that the trends I illustrate up until 2019 are likely to be re-established once the immediate pandemic impacts have eased.
By ‘cumulative increases’ I mean the additional output or additional public expenditure in each year, over and above the 1999 baseline level. Thus when we look at output for each year we are looking at that additional value over that baseline created and available for public and/or private consumption. I have made the assumption that at no point in time do we desire to reduce our private consumption in absolute terms – the decisions we are to take are about future allocation of the gains from our increasing productivity. For illustration purposes I present a counterfactual of the decisions we faced from 2 decades ago until 2019, but there is no reason not to suppose (in fact rather more reason to do so) that essentially the same scenarios face us now.
Methods of Calculation in My Analysis
In the UK’s National Statistics productivity is measured using the concept of Gross Value Added (GVA), which is the inflation-adjusted value output of a sector or industry in terms of its sales (or notional sales value under non-market provision) minus the cost of its inputs. Adding the GVA of every sector together gives us one estimate of the total domestic output of the national economy. Labour productivity is the total GVA for the sector, industry or nation divided by the number of hours worked in that sector, industry or nation, expressed in so many pounds per hour.
Total GVA as provided by ONS statistics includes calculated output for Public Services, combining three categories of the Standard Industrial Classification (SIC): Public Administration and Defence (which includes Judicial Services and Public Order); Education; and Human Health and Social Work services. Since following the privatisation programmes of recent decades the UK government has virtually no direct role in the provision of marketed goods and services, I have simply subtracted the GVA for public services from the total GVA for the national economy to arrive at a figure for the GVA of the UK private consumption (standardisable production) sector. A distinction is not in fact made in the SIC between services provided by central and local government and those provided by the private sector. In the UK however the vast majority of services in all three relevant categories are provided by the public sector. Moreover, if the private sector GVA given by this method is an underestimate this would increase the gaps I show between private consumption GVA and government expenditure, thereby strengthening the thrust of this analysis.
Current Government Expenditure includes the money spent on goods and services provided directly by central and local government, such as health and social care, education, defence and police and judicial services, as well as that spent on pensions and other welfare payments, and that on debt interest payments and contributions to international bodies.
What Might Have Been Available to Spend on Public Services?
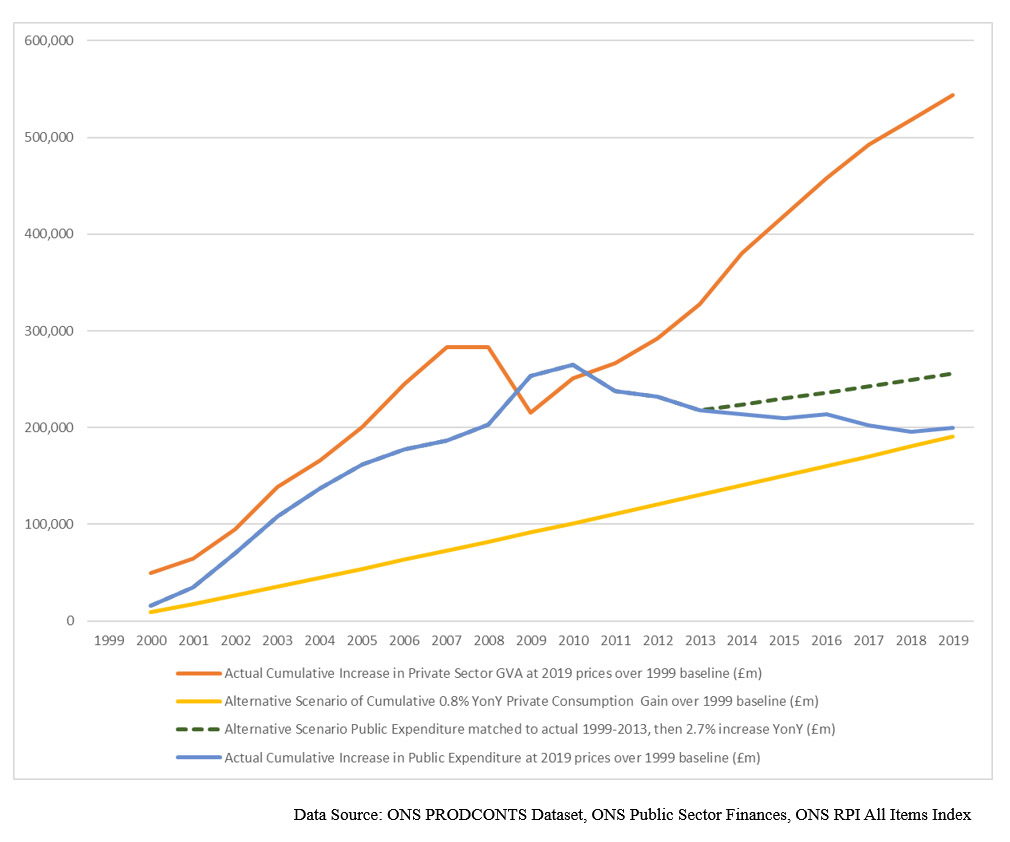
In Figure 3 above I chart the annual additions to GVA from a baseline of 1999 for the market (standardisable production) sector at constant 2019 prices (the orange line), along with annual public expenditure increases over the same baseline (the blue line) also adjusted for 2019 prices using the Retail Price Indices for the relevant years. What this chart shows very clearly is that the additional GVA created outstripped additional public expenditure in every year except the two post-crash recession years of 2009 and 2010. By the end of this 20 year period the total additional value generated amounted to £5.7 trillion, whereas additional public expenditure only amounted to £3.5 trillion – 62% of the additional GVA generated over 1999 productivity levels. This confirms that over this period we could have spent considerably more on public services as a proportion of our domestic output and still consumed additional private market goods each year.
As an illustrative counterfactual I present an alternative scenario where the annual private consumption increase is limited to a constant annual 0.8% from 1999 (as shown by the yellow line on the chart). Under this scenario the resources (primarily labour) required to produce additional value over that 0.8% are instead directed to public services OR the additional output produced over that 0.8% increase was used or exchanged to provide additional public services. An annual rise of real private consumption of 0.8% may not sound impressive, but it amounts to a 17.3% increase by 2019, and in any case as we shall see later it’s more than has been seen by most workers over this period.
Since actual public expenditure tracked the private GVA increase reasonably well from 1999 until the financial crash and then exceeded it during the subsequent recession (as welfare and other payments automatically increased) I have assumed this spending for the alternative scenario until 2013. From 2014 however, I have assumed a constant annual increase in public expenditure of 2.7% until 2019 (shown by the dashed green line). These increases are allowed by the surplus GVA existing over the annual 0.8% increase allocated to private consumption for the complete 1999-2019 period. The alternative scenario now shows a considerable difference from the actual expenditure over the post-2013 period, where continued ‘austerity’ for public services existed in the face of considerable recovery of output for the UK private sector. What is shown is that we could have maintained an increase in total personal consumption of 0.8% every year over the complete 1999-2019 period and still spent an additional £203bn on our public services from 2014 to 2019 – that’s £34bn in each of those years or £651 million per week (all at 2019 prices)![4]
So If We’re Not Spending on Public Services, Where’s the Money?
Of course, the recognition of what we could have done (and so could do in the future) is all well and good. Perhaps we are happy with our decision to have enjoyed more consumer goods and services at the expense of the somewhat frayed public sphere of our schools, hospitals and justice system? But have we really had this enjoyment? As it turns out, for most of us there isn’t much sign of that.
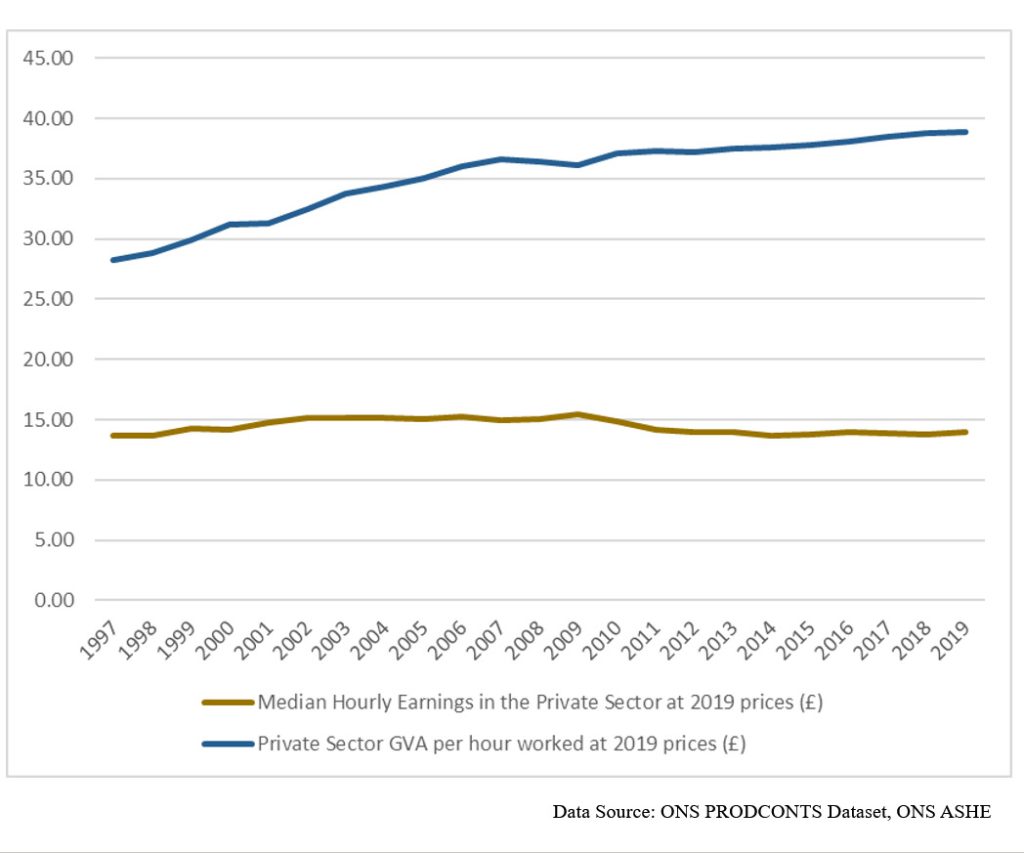
Figure 4 above compares the hourly GVA produced per worker (the standard measure of labour productivity) in the private sector (the standardisable production sector) from 1997 to 2019 with the median UK private sector wage over the same period – all adjusted for 2019 prices, so accounting for the real purchasing value of the wage. Again I have used the ONS industrial sector definitions to make the GVA calculation. The dark blue line shows that private sector labour productivity increased from £29.87 per hour in 1999 to £38.88 in 2019 – a 38% increase in real output per worker. Over the same period the median hourly private sector wage (the wage above which the same number of workers earn as the number of workers who earn below it) when calculated at 2019 prices went from £14.25 in 1997 to a high of £15.49 in 2009, before falling back to £13.98 in 2019, an overall 2% decrease over the starting point.[5] None of the increase in productivity over this period has been available to the typical private sector worker for their own consumption. The people responsible for providing the work whose productivity has raised the relative output in Baumol’s high productivity sector are neither receiving the benefit of their increased productivity as high-quality public services nor as additional private consumption. They are quite simply being cheated.
After accounting for the 47% share of private sector output going to government expenditure in 2019, if the typical UK private sector worker had individually received the full benefit of their additional output, instead of a decrease they should have seen an after-tax hourly wage increase of £2.87 from 1999 to 2019. Even if we had restricted individual consumption expenditure to the 0.8% annual increase and transferred the balance to public services as postulated previously, after taking the significant increase in the workforce over 20 years into account, an equal distribution of the additional consumption would have seen a £0.31 after-tax increase on the 1999 hourly wage by 2019. Not a huge amount admittedly, but better than the actual decrease, and accompanied by a large boost to our public services.
The alternative scenario of increased public expenditure would have altered the share of government expenditure in total monetary GVA (private and public sector) from the actual 38% to an increased 46% in 2019, but one lesson from this article should be that this share is a spurious measure. The differential productivity between the standardisable and non-standardisable sectors and the consequent differential cost trends mean that for the true value of public services to stay constant, its monetary value will inevitably increase. In this case a rising share in government expenditure in the economy is not a sign of increased government dominance – it is a monetary illusion induced by the Baumol Effect and so should be ignored.
Conclusion – How the Baumol Effect Allows the Government to Mislead Us
Our public services are in crisis. The Conservative government tells us that we are getting what we can afford. Intuitively many of us find this puzzling, given how much richer our country has become over the past decades. We are right to be puzzled – we have been lied to, and cheated.
The cheating is hidden by a counter-intuitive phenomenon – the ‘Baumol Effect’. This phenomenon has the effect of making public services appear more expensive, even although they are in reality more affordable than ever. This arises because of some basic facts about the production of different types of goods and services. Because most of the goods we use and consume day to day are producible and marketable using standardised processes, innovations regularly make it possible to provide them ever more efficiently and cheaply. In contrast, public services such as healthcare, social care, education and legal services usually require face to face interaction with trained individuals in a way that is much more difficult to standardise and make significantly more ‘efficient’ without wholesale changes (often unwelcome) in the way these services are provided. Because wages tend to increase with productivity (although this is not the ironclad phenomenon economic theory might suggest) and people have a choice of working in the ‘high’ and ‘low’ productivity sectors, wages in the two sectors tend to equalise. As a consequence the provision of public services becomes more expensive relative to consumer goods and services. Crucially however, these public services only become relatively more expensive with respect to privately consumed goods. In absolute terms these services become more affordable because we need give up fewer private consumption goods for the same level of services. This is obscured by the fact that the measurement of price changes (inflation) is weighted using a basket of mainly private consumption goods and services.
We are not condemned to poor public services – far from it – so we should have a choice as to how we use our gains from our enhanced productivity in private goods and services. If we make a democratic decision to enjoy greater private consumption at the expense of quality public service provision, then so be it. But currently that is not happening. The vast majority of us are seeing neither, and we are unaware of the choice we have because it is hidden from us – either deliberately or through a failure of economic understanding. Moreover, the polarised nature of British politics created through the lens of an outdated and no longer fit-for-purpose electoral system does not encourage any common understanding of such choices.
[1] Baumol’s illustrative example was that of a Schubert String Quartet – it took 4 musicians 35 minutes to play in the 19th century, and takes the same quantity of person-hours today!
[2] See eg: Hartwig, J. 2006, What Drives Health Care Expenditure? Baumol’s Model of ‘Unbalanced Growth’ Revisited, Working Paper No 133, Swiss Institute for Business Cycle Research https://doi.org/10.3929/ethz-a-005187505; Bates, L. J., Santerre, R.E., 2013, Does the U.S. health care sector suffer from Baumol’s cost disease? Evidence from the 50 states, Journal of Health Economics, 32, 2, 386-391 https://doi.org/10.1016/j.jhealeco.2012.12.003; Colombier, C., Drivers of Health Care Expenditure: Does Baumol’s Cost Disease Loom Large?, FiFo Discussion Paper No. 12-5, https://ssrn.com/abstract=2341054 or http://dx.doi.org/10.2139/ssrn.2341054
[3] See https://www.kingsfund.org.uk/publications/how-health-care-is-funded for a discussion of the merits of different healthcare funding models.
[4] Readers will no doubt recall a Brexit benefit claim made in the 2016 referendum of ‘£350 million per week for the NHS’ – a claim that has yet to be realised.
[5] This chart also demonstrates the significant fall-off in UK productivity since the 2008 financial crash which acts as a further squeeze both on public services and private consumption. See https://www.ft.com/content/e7a8cb3a-efcc-4d62-962b-d284545c14f6 for a discussion.