The Missing (Men?)
A second issue which can be read between the lines of Portes’s article is the discrepancy over the last decade between a steady employment rate and falling numbers of out-of-work benefit recipients. And indeed on closer inspection of the figures, since 1999 there has been an increase of over 1.7 million of the 16-64 population who are neither employed nor receiving the key out-of-work (KOW) benefits: JSA, IB/ESA and IS. This is shown in Figure 4 below. So there are already an increasing number of people neither in work nor receiving benefits. Interestingly, it seems that the majority of this group are still declaring themselves as economically active, since the inactive population has only increased by 0.6 million over the same period.
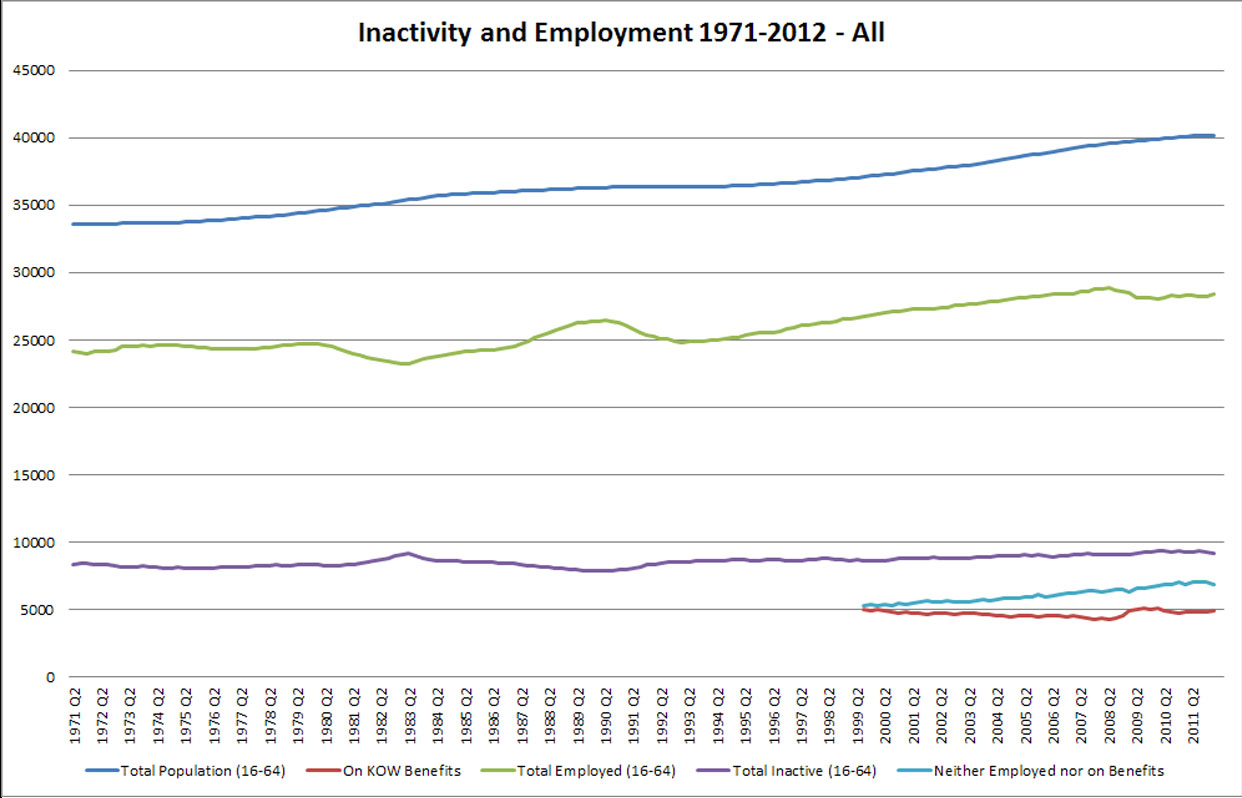
Who are these people, and what is the implication of their rising numbers? Unfortunately gender-specific benefit numbers are not available, but given the rising numbers of women in employment it seems almost certain that the vast majority are men. Maybe they are all men who are wealthy enough not to need to work, but if so what has allowed this number to rise by so much over a decade? The more worrying scenario is that we have a rising group of men who are seeking their living outside the legal economy or are even further detached from the economy and society. This is surely storing up problems for the future.
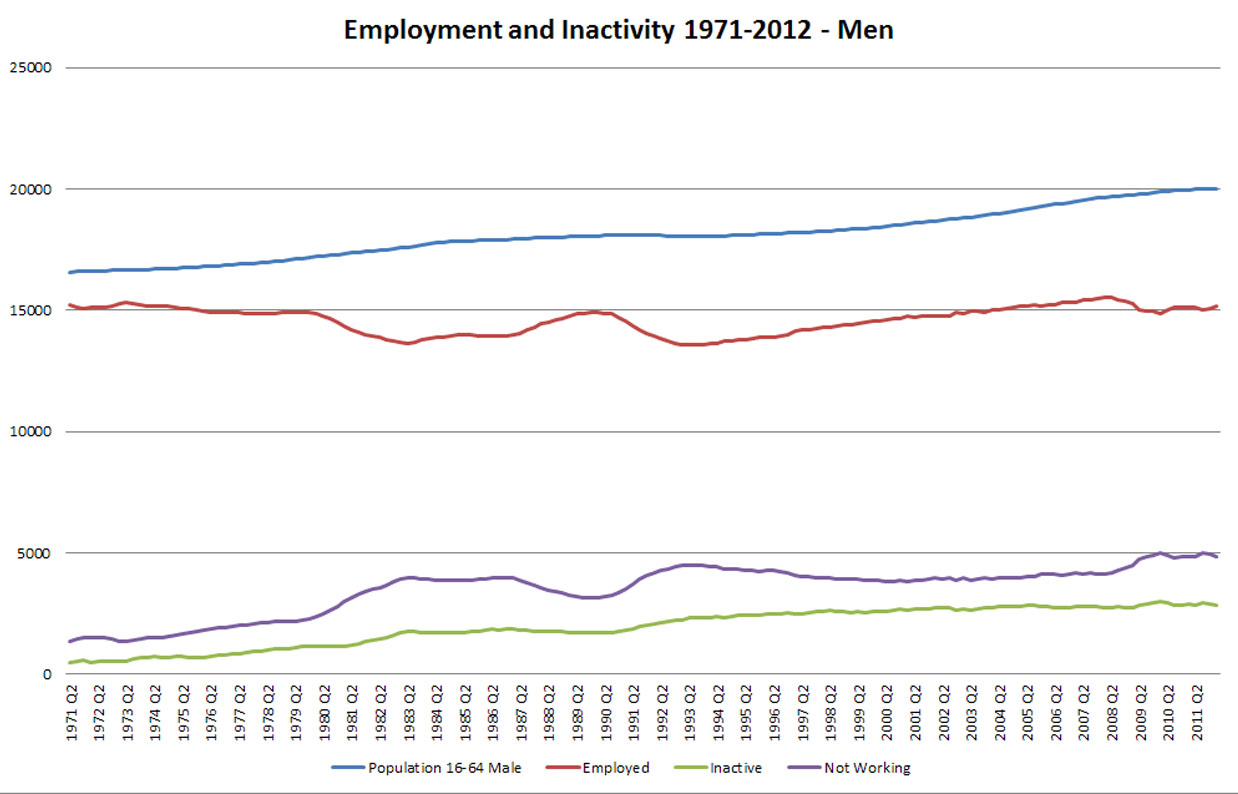
Moreover the upward drift between 1999 and 2008 in the number of men who were not working, despite the ‘sticks and carrots’ of policy that resulted in the fall in benefit claimants, suggests that at least for men ‘active labour market policy’ was not even in the past the success Portes would like to claim for it. This is shown in Figure 5.
In a future post I will consider some alternative approaches to the UK’s apparent labour market failures.
One reply on “Unemployment and Policy”
[…] up, employment, from Dr.D. I’ll have to re-read this more […]